
Neuroradiology 2017 Conferences Readership Profiles: Key Metrics (Source: Google Analytics)
A statistical representation of global users for neuroradiology.conferenceseries.com(Source: Google Analytics)
International conferences Readership profiles: Key Metrics (Source: Google Analytics)
Here is the dashboard of Google Analytics survey of the “Conference on Neuroimaging and Interventional Radiology” which describe the participation interest from all around the world’s Neuroradiologists, Interventionists, Researchers, Academia, Scholars, businessman, societies and organizations in Neuro radiology 2017 conference who are seeking to join and present their research discoveries on exceedingly recognized universal gatherings like our own with the web activity an aggregate 16,238 visits. The aggregate site visits were 35,858 where our reports are analysed half yearly
Neuroradiology 2017 Google Analytics Metrics: At Glimpse
- On average 10,792 Visitors survey this meeting website to participate and submit their research proposal
- Most astounding number of Visitors reporting both from the advanced and leading countries
- For leading countries specialists our Neuroradiology 2017 event is measuring stick to evaluate their research proposition submitted
- Most of the visitors have reach out website from 10 territories/countries from US, UK, Russia, Germany, Canada, Spain, Australia, Turkey, Japan, South Korea, Brazil, France, and China.
- Going through the study of guest, navigator and activities to investigate the accomplishment of our event throughout the world majority of traffic we have getting from the cities like New York, London, Sydney, Seoul, Lagos, Ottawa, New Delhi and Hyderabad.
- Our visitor spent time on an average is 2.34 minutes.
The Traffic Sources determines that the count of Unique Visitors of the Neuro radiology website listing from renowned colleges and universities, research institutions, societies and organizations.
Reasons behind listing Neuroradiology on top of search engines: (Source: Google)
- Researchers are willing to attend only the conferences where their profiles are design with the accomplishment and research interest
- Specialists from all over the world chose conferences where their research work and abstract will get most readerships worldwide.
- The easiest way for all academia, researchers to increase their exploration profiles through the contributions to give presentations in our conference.
- Our meetings provide international connections with researchers in their own research of interest.
- Researchers get the way to publish their article in the relevant journals with the high impact factors.
- One and only a single platform for all the researchers to explore their knowledge and discover latest advancement in their era of research.
Apart of all this, we also make separate pages for all the speakers where their profile is display with biography and abstract are updated on daily basis for advertising their presence in searching sites and social networking like you tube channel, Facebook, LinkedIn.
Global Internet users for conferenceseries.com: Statistical representation (Source: Google Analytics)
Flip on the other side Conferenceseries world’s leading specialist in organizing scientific conferences, events trade, and consumer exhibitions both domestically and internationally in different verticals and horizontals like Medical, Pharma, Engineering, Science, Technology and Business attracting more than 25 Million+ Visitors, 25000+ unique visitors per conference and 70000+ page views for every individual conference would help in quantifying our presenters research and biography visibility to the online communities and get recognized worldwide.
Conference Series Web Metrics at Glance: Source: Google Analytics
- 25 Million+ Visitors
- 25000+ unique visitors per conference
- 70000+ page views for every individual conference
Out of the 500,000 listing worldwide major conferences attended by 2.5 million attendees 16.8% attendees are drawing only from our Medical, Pharma, Healthcare, Nursing, Engineering, Science, Technology and Business conferences. The main reasons behind the increased popularity of our conference attendees is because of the changing mindsets of academicians, researchers and industries in exploring the opportunities for exchanging ideas, sharing resources, building networks and increase awareness of the on the recent happenings in their research around the world.
“Attending and presenting at conferences remains as the most favorable model of knowledge dissemination for researchers and practitioners to keep abreast of all advances in their field, presenting state-of-the-art research usually on a variety of subjects”
We will continue to set our bar higher and make further progress to organize 1000 conferences in 50 countries across all continents by 2018. We have recently launched online digital video library where all our conference proceedings would be shared and be accessed by the online communities freely.
Channels for driving additional traffic to your research
Web Analytics are best means of measuring concrete details like how many people are visiting our websites, how many of those visitors are the unique visitors and how many of them are staying long to view the complete information available in our sites. The following snapshots of some of our websites will clearly depict the metrics how our conferences stand at par to the other conferences in terms of Visibility, outreach, Participation Number and relevance to their subject.
The metrics of these websites represents more than 25+ Million visitors in addition to this we also equipped with 10 additional scientific websites represents 10+ Million visitors traffic to our conference websites.
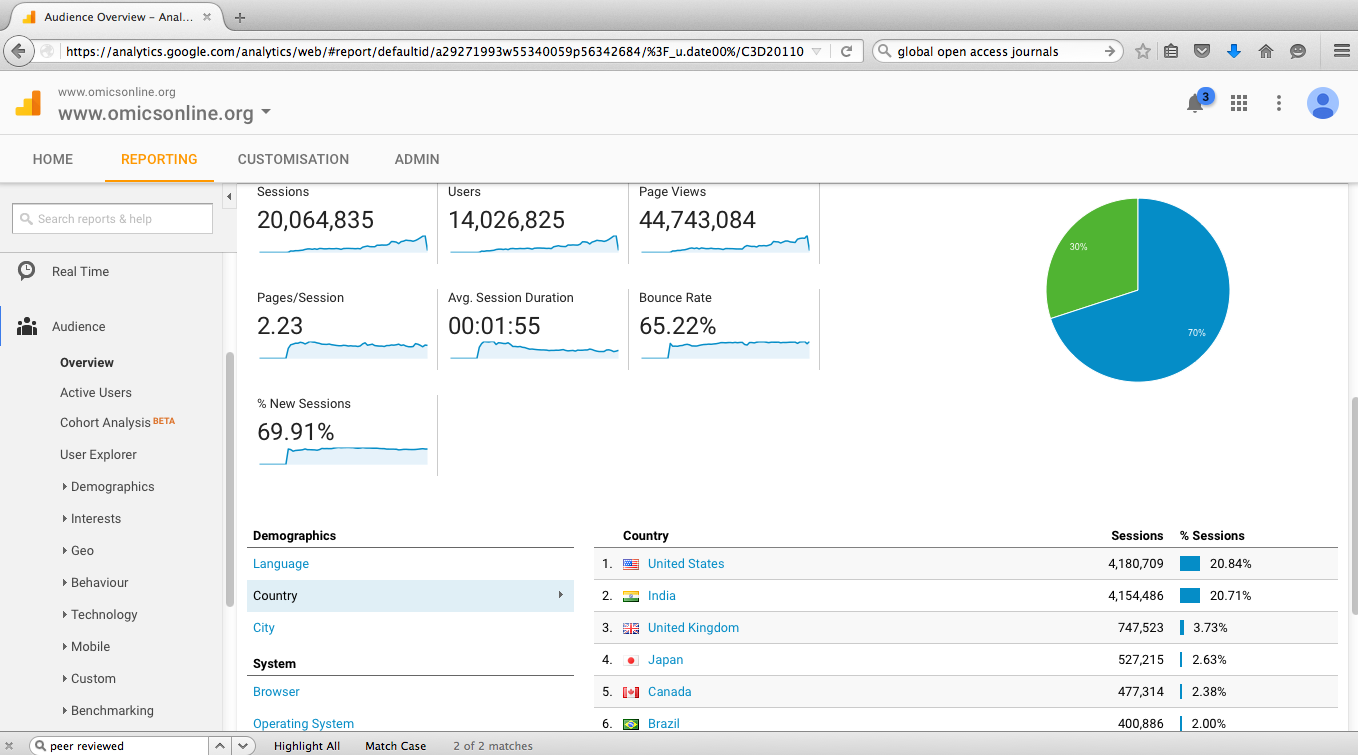
A statistical representation of global users for www.omicsonline.org (Source: Google Analytics)
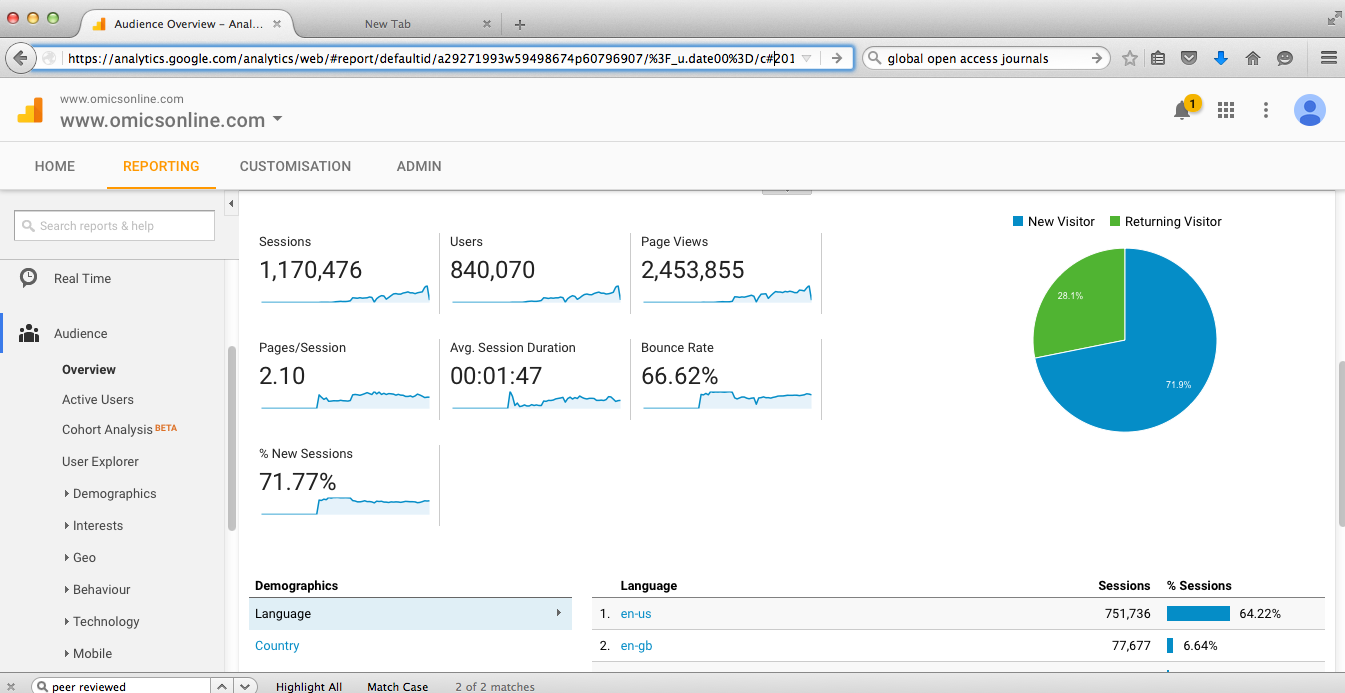
A statistical representation of global users for www.omicsonline.com (Source: Google Analytics)
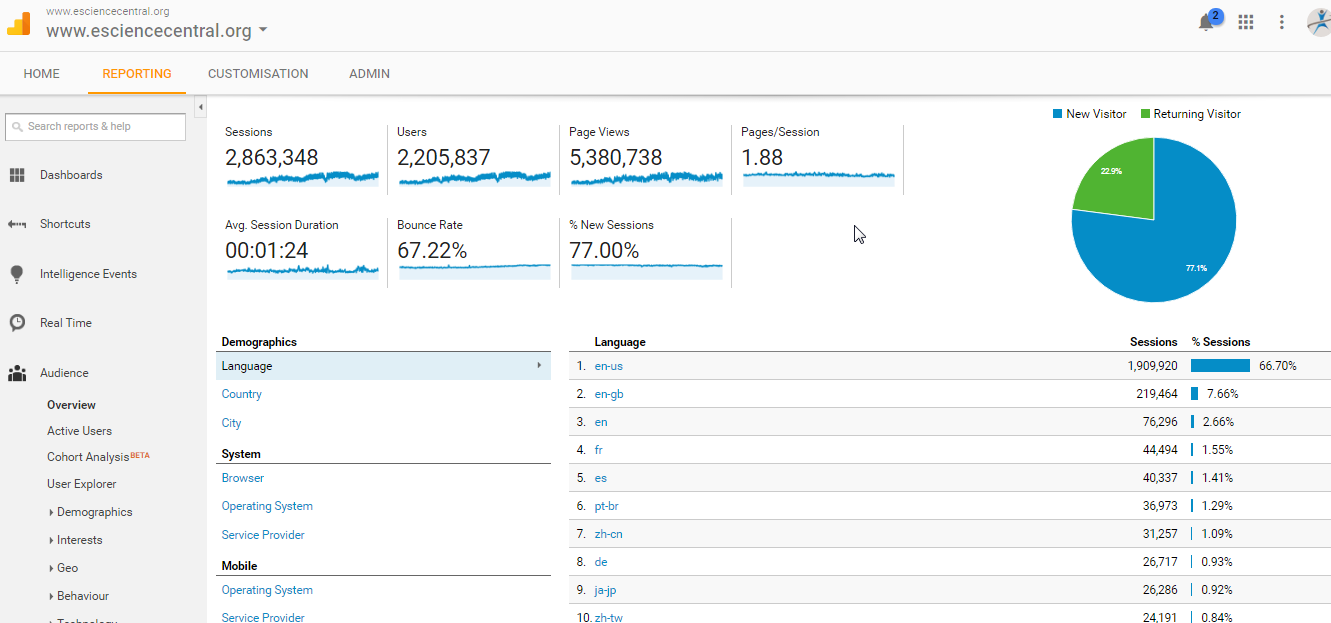
A statistical representation of global users for www.esciencecentral.org (Source: Google Analytics)
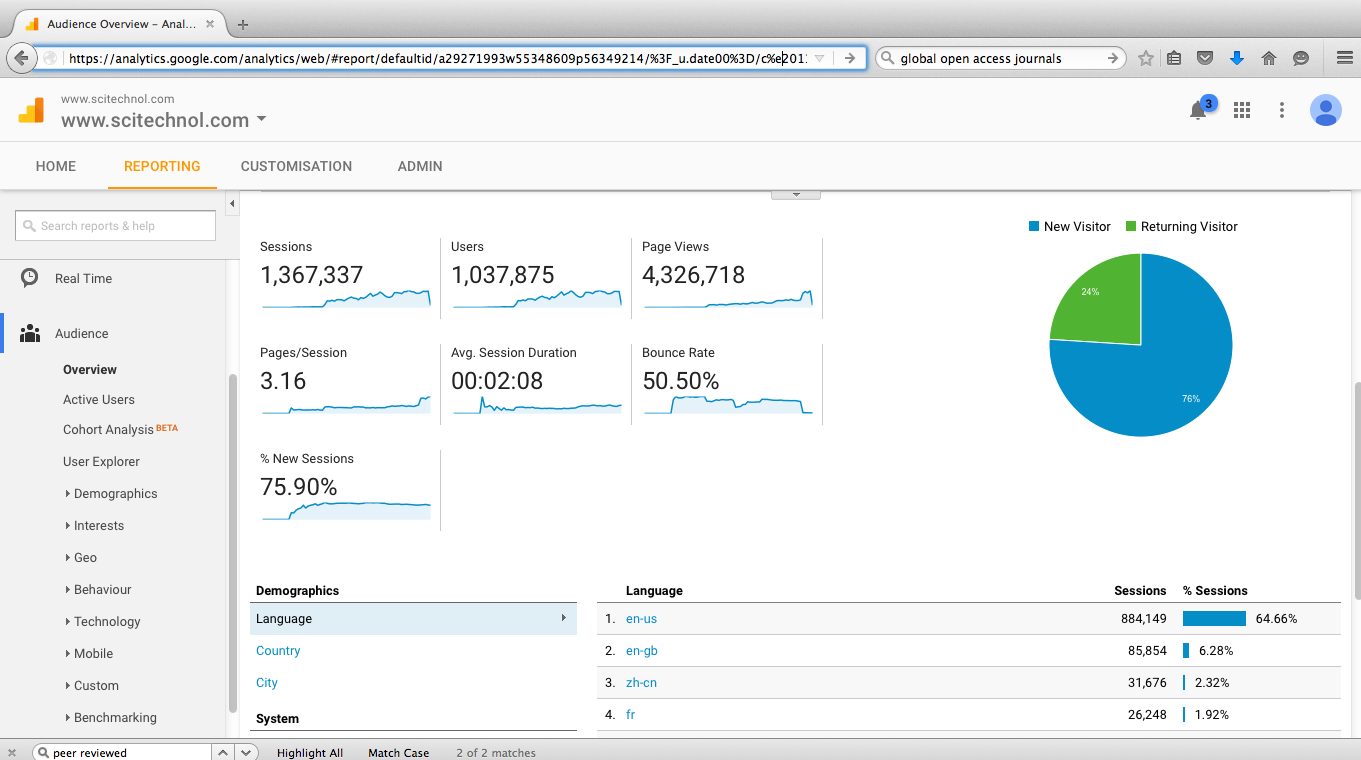
A statistical representation of global users for www.scitechnol.com (Source: Google Analytics)
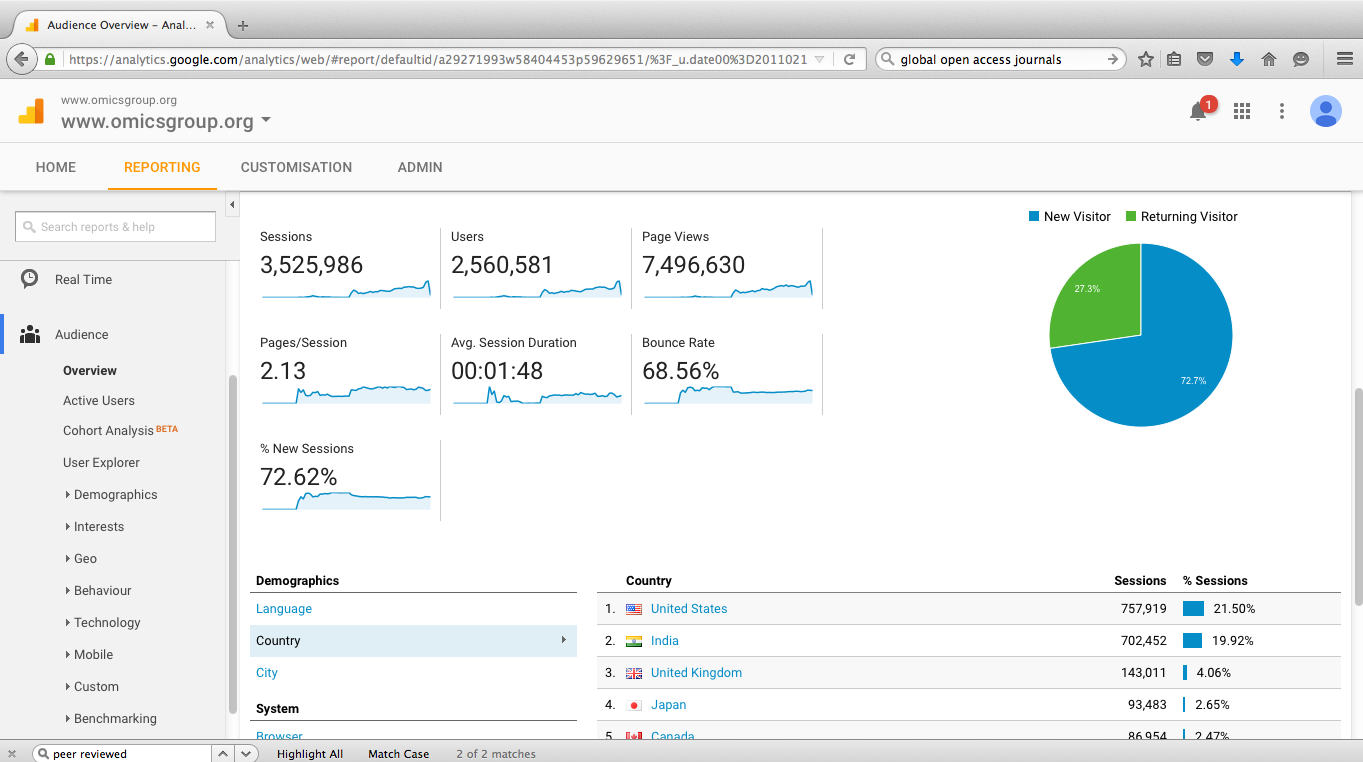
A statistical representation of global users for www.omicsgroup.org (Source: Google Analytics)

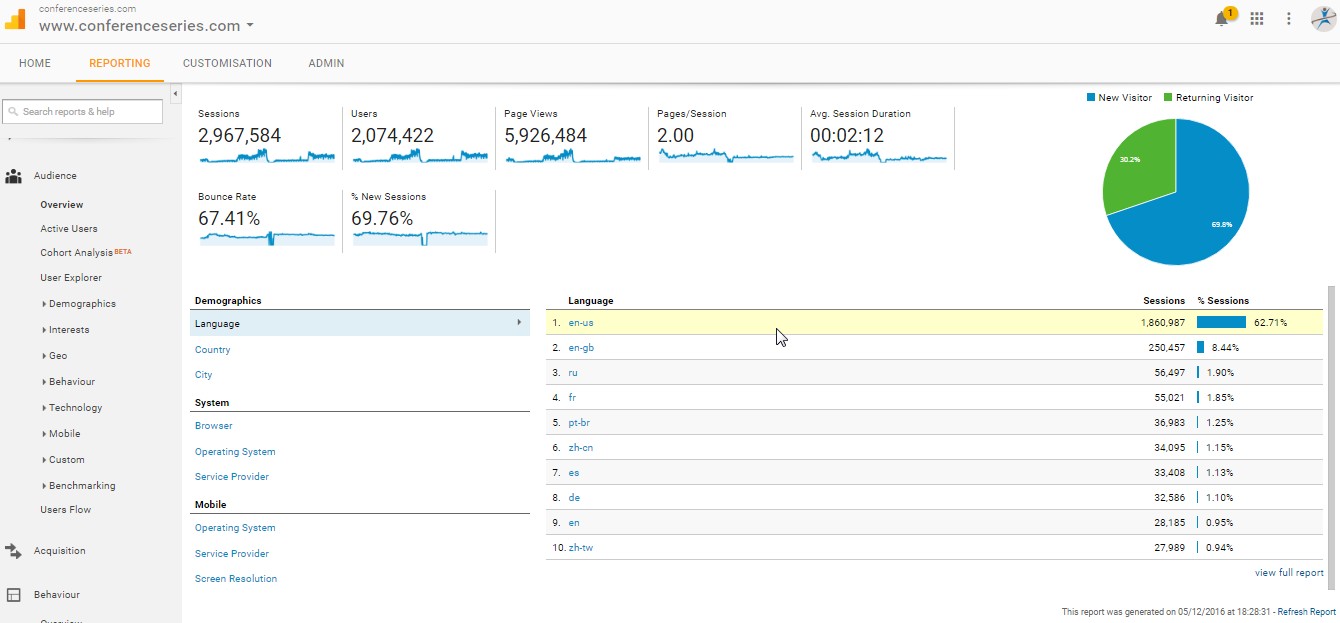
A statistical representation of global users for www.conferenceseries.com (Source: Google Analytics)